منصة عمليات التجارة الإلكترونية الذكية
التنبؤ بالطلب يطلق أوامر الشراء تلقائياً قبل نفاد المخزون — وليس بعده
Overview
AI-powered inventory and operations platform for a multi-region retail group operating 5 warehouses across the US and Australia. Replaced manual inventory management with an intelligent system that forecasts demand, automates supplier ordering, and optimises stock positioning across locations.
The Challenge
The client was caught between two expensive problems simultaneously — overstock carrying costs (averaging $180K per quarter in dead inventory) and stockouts (losing estimated $340K quarterly in missed sales). Manual forecasting by their buying team was based on last year's performance and gut feel, with no ability to factor in external signals like seasonality, promotions, or competitor activity.
What We Built
A unified operations platform with three modules: demand intelligence (AI forecasting + supplier automation), warehouse management (real-time stock levels, location optimisation, pick-path routing), and operations dashboard (cross-warehouse visibility, reorder alerts, supplier performance tracking).
Tech Stack
النتائج
خفض تكاليف التشغيل 40% · تراجع نفاد المخزون 23%
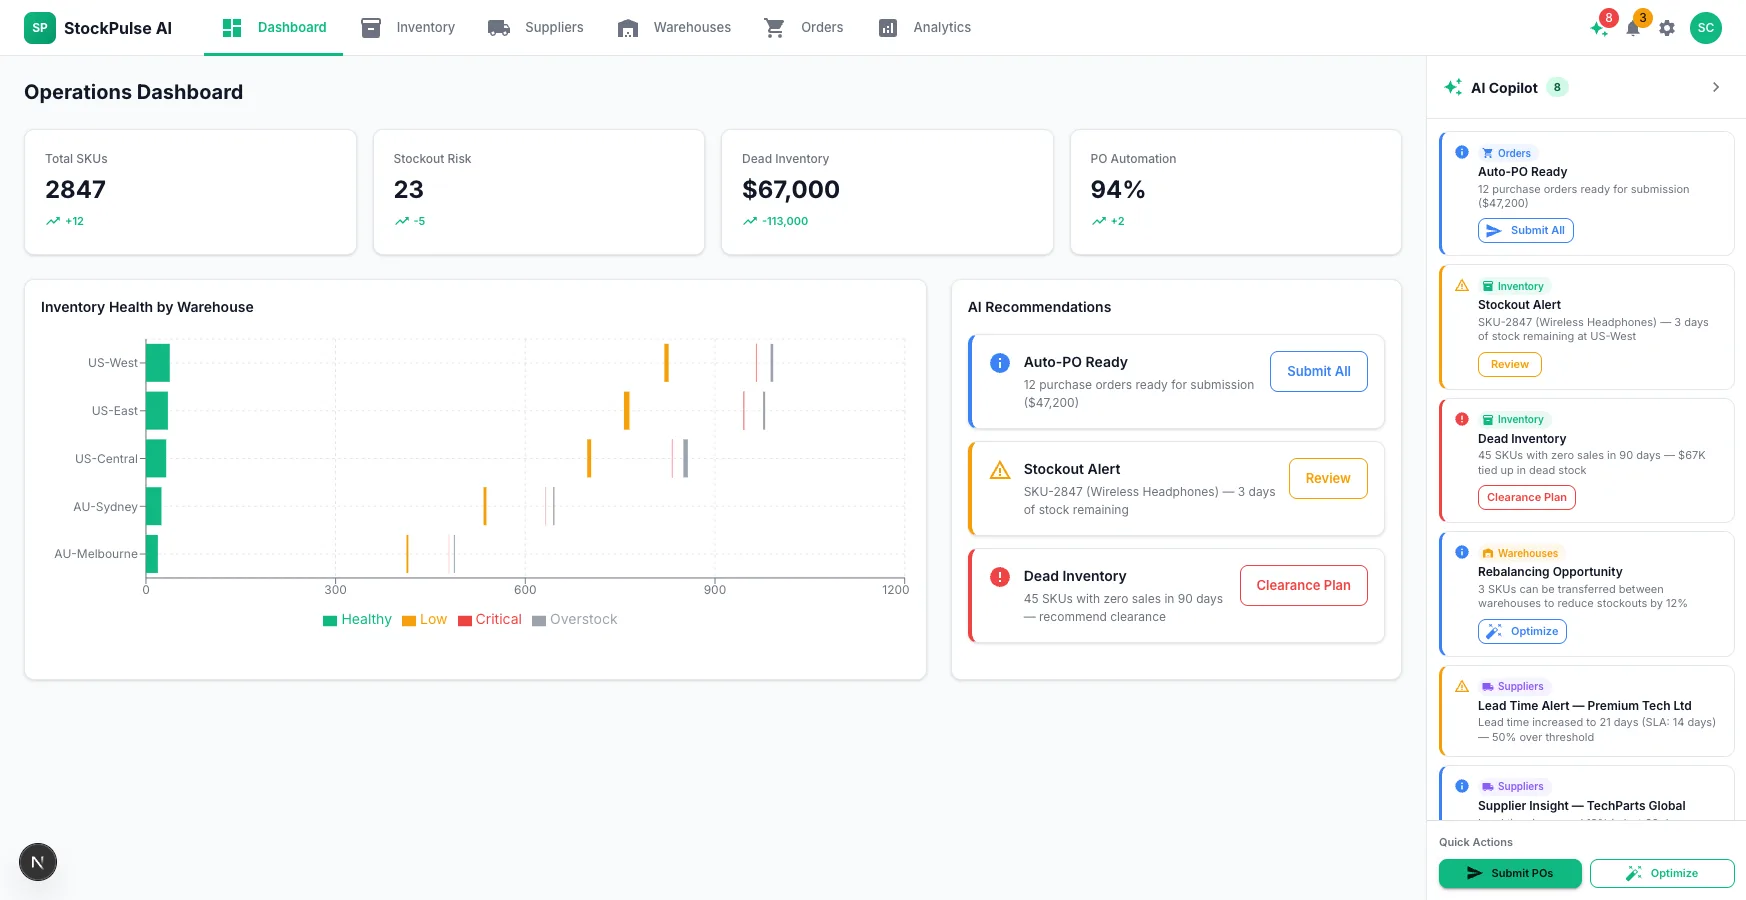
Operations Dashboard
A single morning-view across KPIs, inventory health, and AI-generated alerts — everything an operations lead needs before their first coffee.
- 4 KPI cards: Total SKUs (1,247), Active SKUs (1,142), Monthly Revenue ($2.4M), Warehouse Utilization (78%)
- Inventory Health bar chart showing stock-level distribution across warehouses
- AI Insights feed: dead inventory alerts, PO confidence flags, supplier lead-time warnings, overstock notices
- Quick Actions: Submit POs, Optimize — one-click from the dashboard to the next step
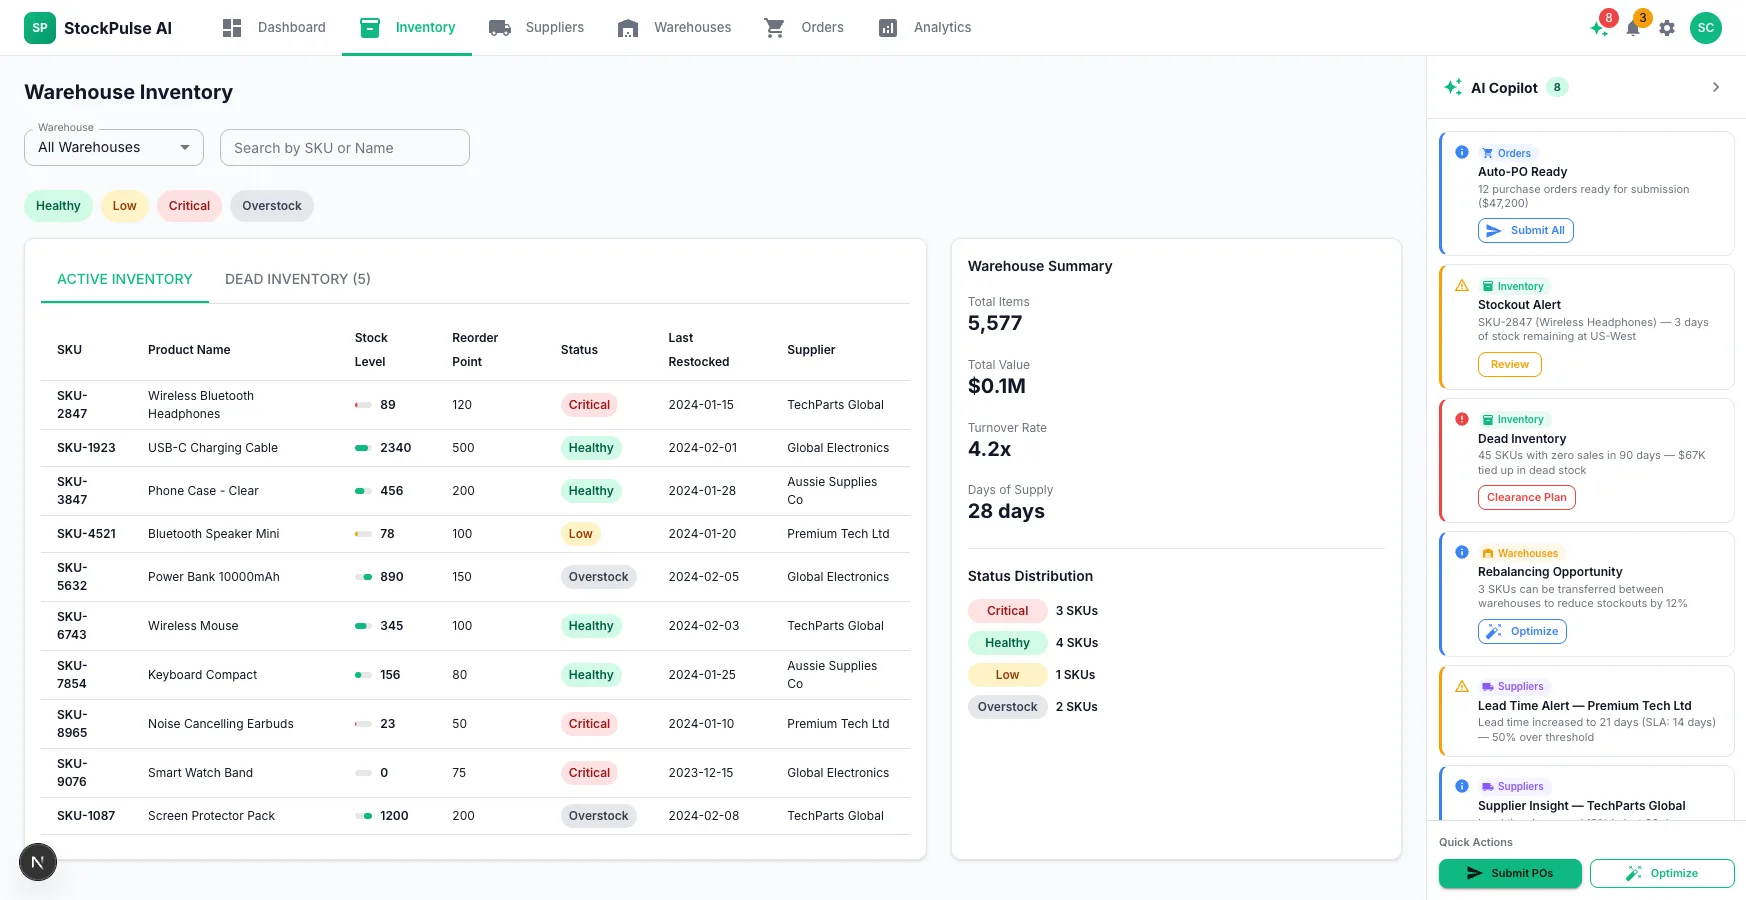
Active & Dead Inventory
Full SKU-level visibility across three warehouses — who has what, how much, and where the money is tied up.
- Active Inventory tab: SKU table with stock levels, warehouse assignment, status badges, and last-sale dates
- Warehouse Summary grid: LA (312 SKUs, 82% util, $847K), Sydney (298 SKUs, 91% util, $623K), London (287 SKUs, 76% util, $534K)
- Dead Inventory tab: 45 SKUs with zero sales in 90 days — $67K tied up in dead stock
- AI Recommendations: Clearance Plan and Rebalancing Opportunity cards with one-click actions
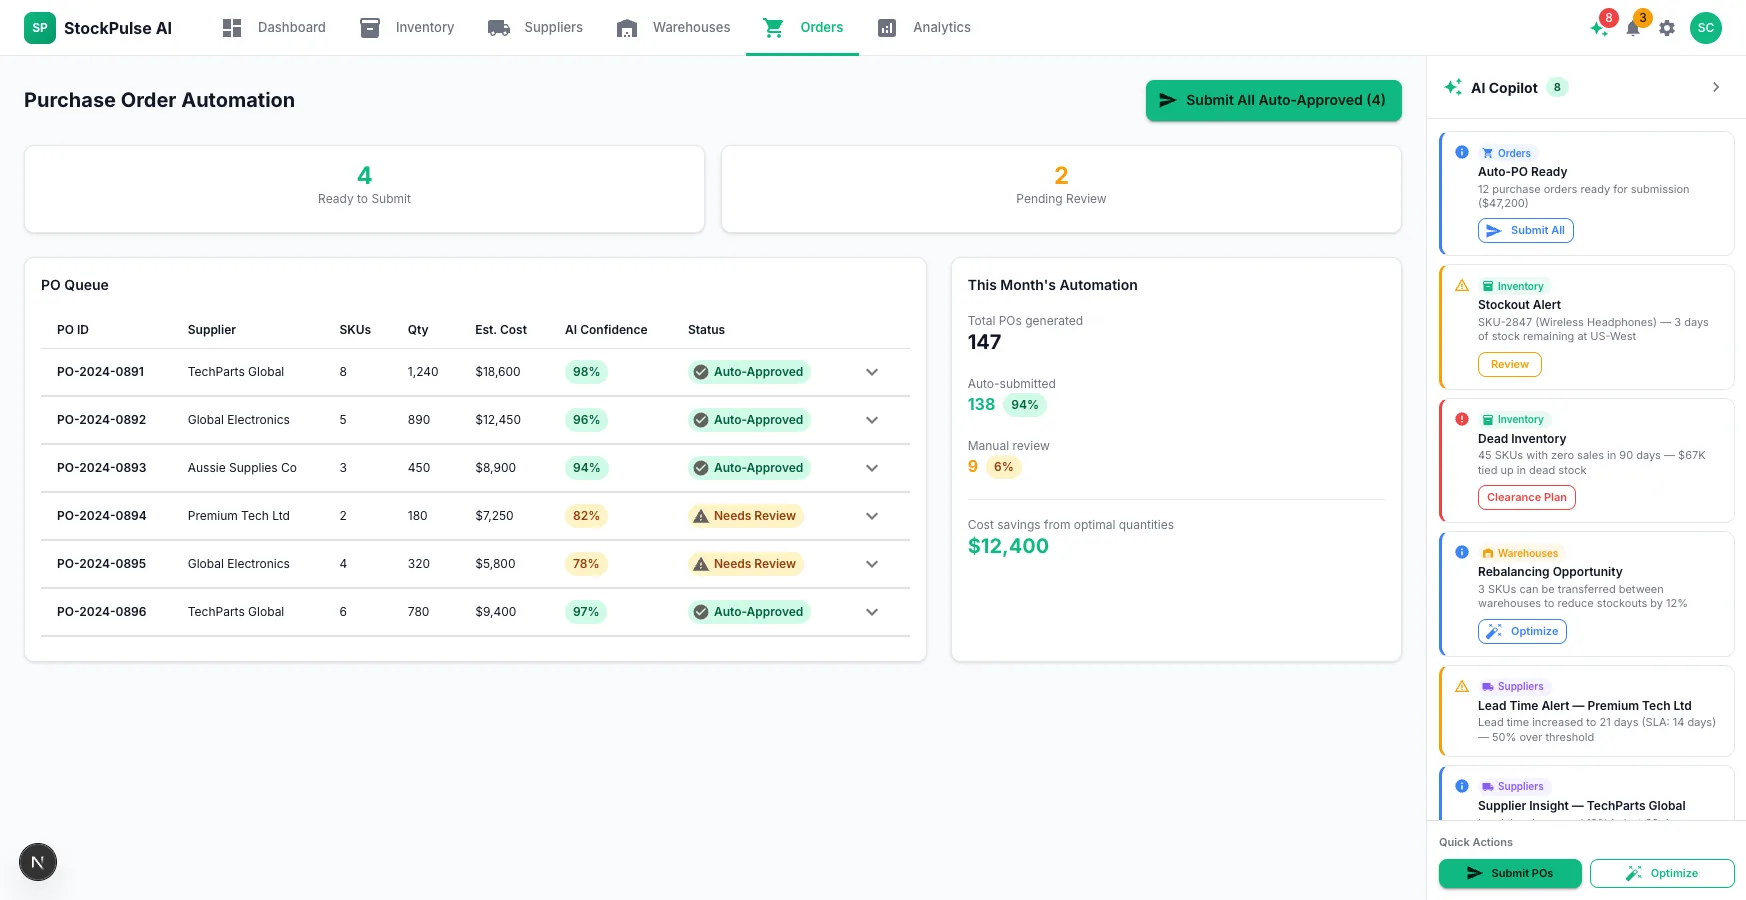
AI Purchase Order Queue
Auto-generated POs ranked by AI confidence — review the low-confidence ones, approve the rest, and never miss a reorder window.
- PO Queue table: PO number, supplier, items, total cost, AI confidence score, status
- Confidence scores from 96% (auto-approved) down to 78% (needs review), with Review buttons on low-confidence rows
- Auto-generated POs section: 2 POs flagged below 90% threshold for manual review
- Pending Review count badge (2) in the page header — clear signal of outstanding work
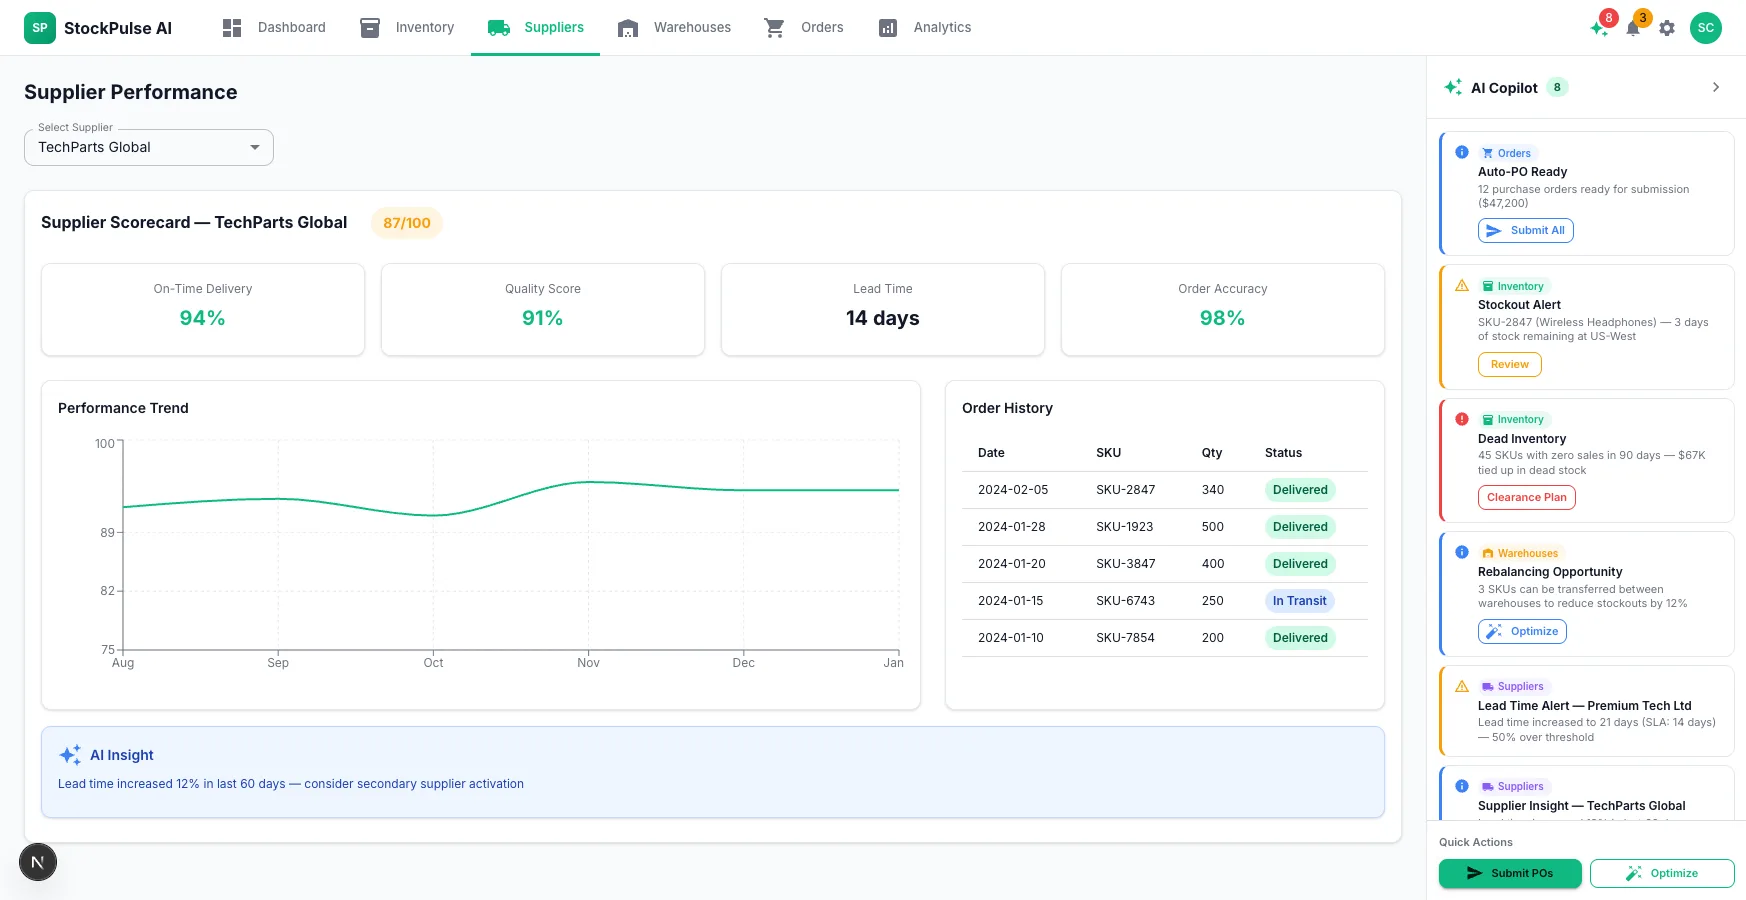
Supplier Scorecard
Side-by-side supplier performance with trend sparklines — the data you need before renewing a contract or switching vendors.
- Scorecard table: supplier name, performance score (94, 91, 87, 82, 76), on-time delivery %, quality score, pricing competitiveness
- Performance Trend column: inline sparklines showing 6-month trajectory per supplier
- Color-coded scores: green (90+), yellow (80–89), red (below 80) — instant read on who needs attention
- Filters for Region and Category to narrow by warehouse or product type
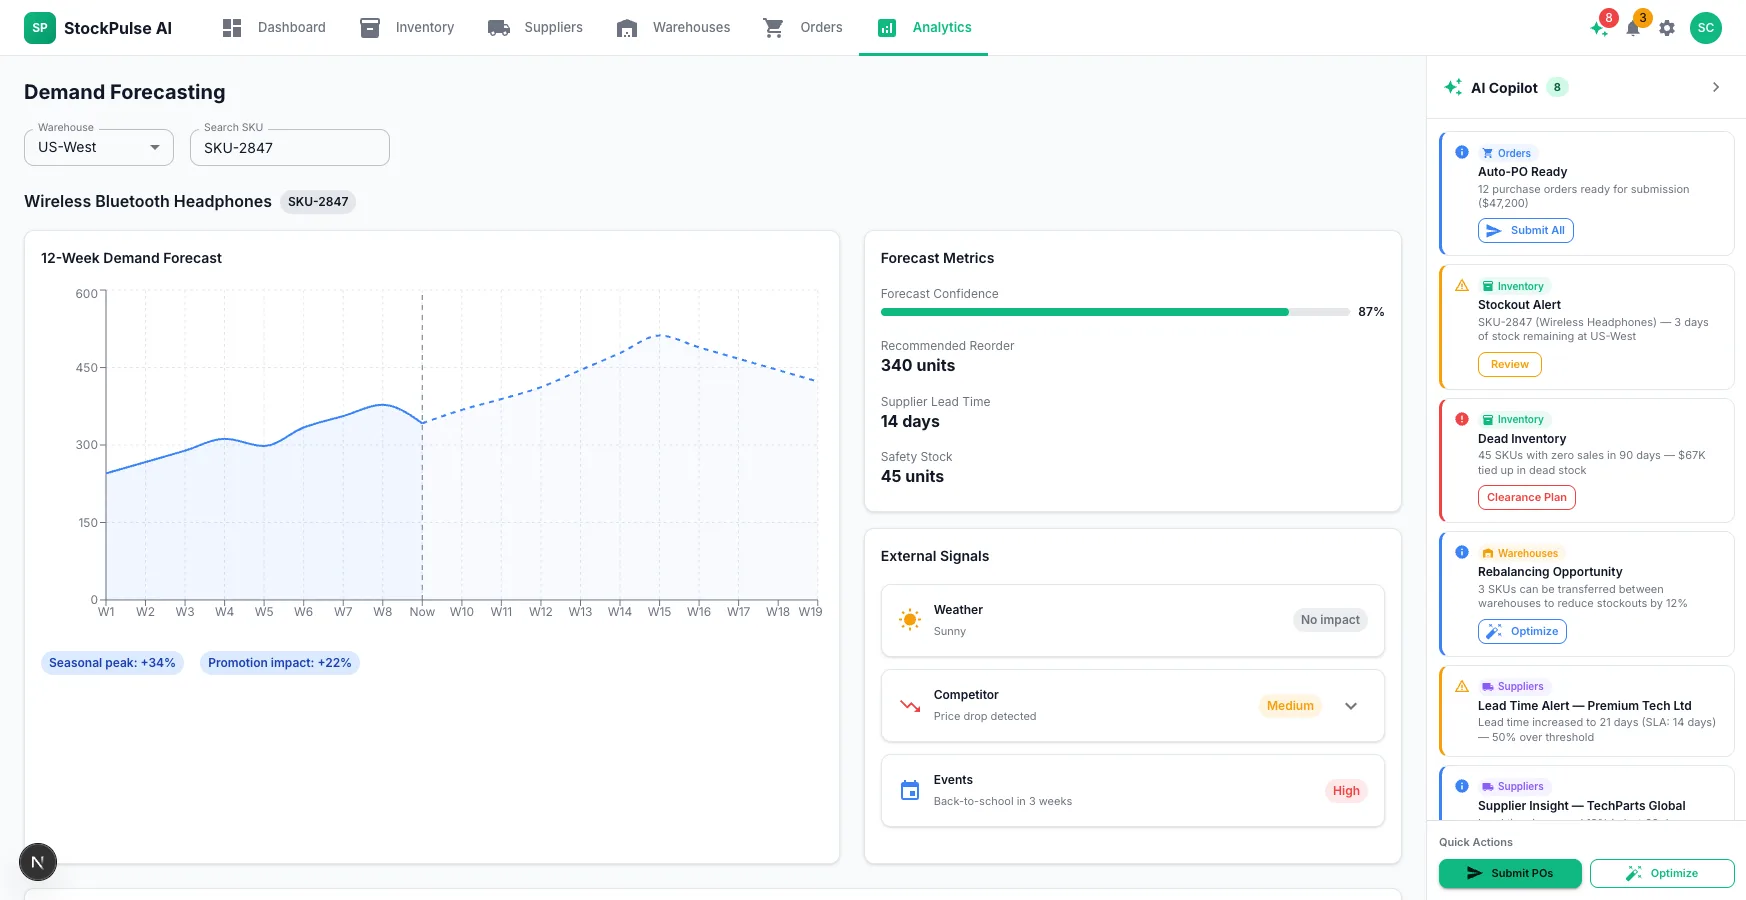
Demand Forecasting with External Signals
ML-powered demand forecasts that factor in weather, social media trends, and competitor promotions — not just last month's sales.
- Forecast Horizon selector: 7, 14, 30, 60 days — accuracy 94.2%, MAE 23 units
- External Signals panel: Weather (Sunny, 24°C), Social Media (342 mentions, +12% WoW), Competitor Activity (2 running promos)
- Inventory Health Trend: stacked bar chart showing healthy vs. low vs. overstock across months
- AI-generated insight: "Social media buzz for summer dresses is up 12% — consider increasing stock by 15%"
The AI Layer
The demand forecasting model analyses 18 months of sales history per SKU, cross-referenced with seasonal indices, promotional calendars, competitor pricing signals (scraped via API), and external data feeds (weather for seasonal categories, events for location-specific stock). It produces a 12-week rolling forecast per SKU per warehouse with confidence intervals. When forecast inventory falls below the reorder threshold — accounting for supplier lead time — the system automatically generates and submits a purchase order to the relevant supplier via their API. The buying team reviews only flagged exceptions, not every order.
Results
- •Ops cost reduced 40% (combination of overstock reduction and automation savings)
- •Stockout rate reduced 23% in first quarter post-deployment
- •Dead inventory carrying cost reduced from $180K to $67K per quarter
- •94% of purchase orders fully automated — buying team reviews exceptions only
- •Deployed across 5 warehouses in 2 countries in 45 days