AI Engineering Analytics & Performance Platform
Surfaces bottlenecks 2–3 weeks before sprint failure — privacy-first, no code ever read
Overview
Enterprise engineering performance platform that gives VP Engineering and CTO-level leaders a real-time view of team velocity, code quality trends, deployment frequency, and individual contributor health — without surveillance. Deployed across 4 enterprise engineering teams across the US and UK.
The Challenge
Engineering leaders at both clients were flying blind. They had data — GitHub, Jira, CI/CD logs — but no way to synthesise it into actionable intelligence. Sprint failures were only visible in retrospect. Developer burnout was only noticed after someone resigned. They needed foresight, not hindsight.
What We Built
A platform that ingests data from GitHub, Jira, Linear, and CI/CD pipelines — normalises it into a unified engineering intelligence model — and delivers three outputs: a real-time dashboard for engineering leads, a weekly digest for VP Engineering (three actions, not thirty metrics), and an early warning system for sprint risk and contributor burnout.
Tech Stack
Key Outcome
28% better sprint predictability · 4 enterprise teams
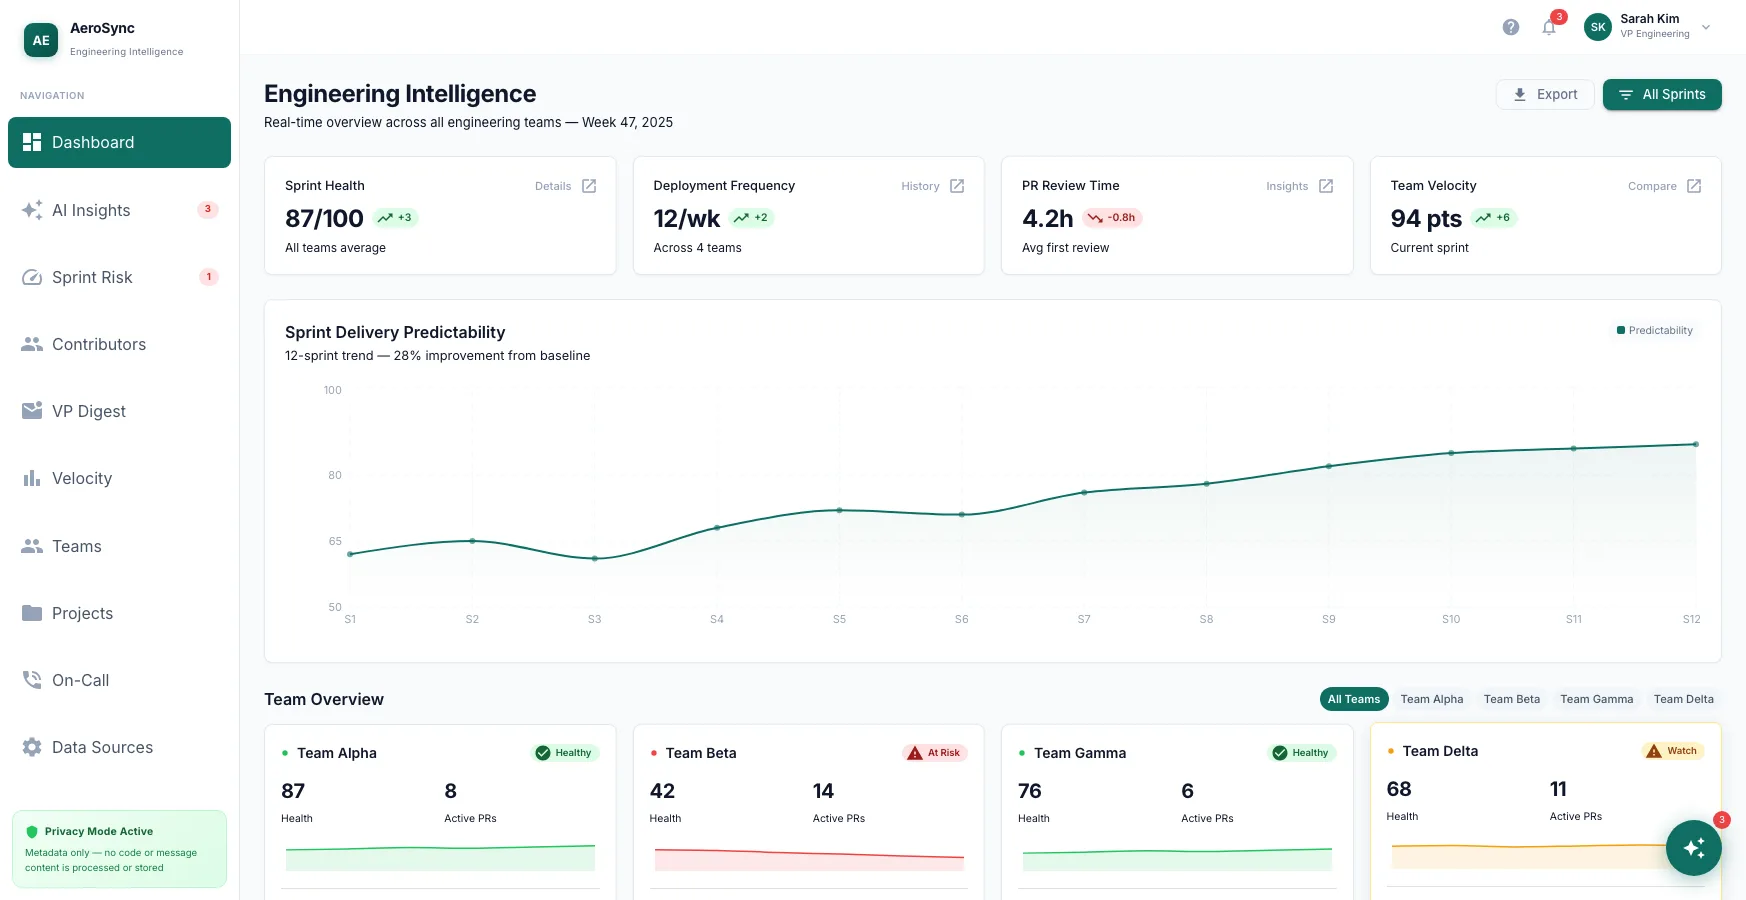
Engineering Intelligence Dashboard
A real-time view across all engineering teams — sprint health, deployment frequency, and velocity in one glance.
- 4 org-wide KPI cards: sprint health, deploy frequency, PR review time, velocity
- 12-sprint predictability trend showing 28% improvement from baseline
- Per-team health cards with status badges (Healthy, At Risk, Watch)
- Recent activity feed across PRs, deploys, and sprint alerts
Sprint Risk Early Warning
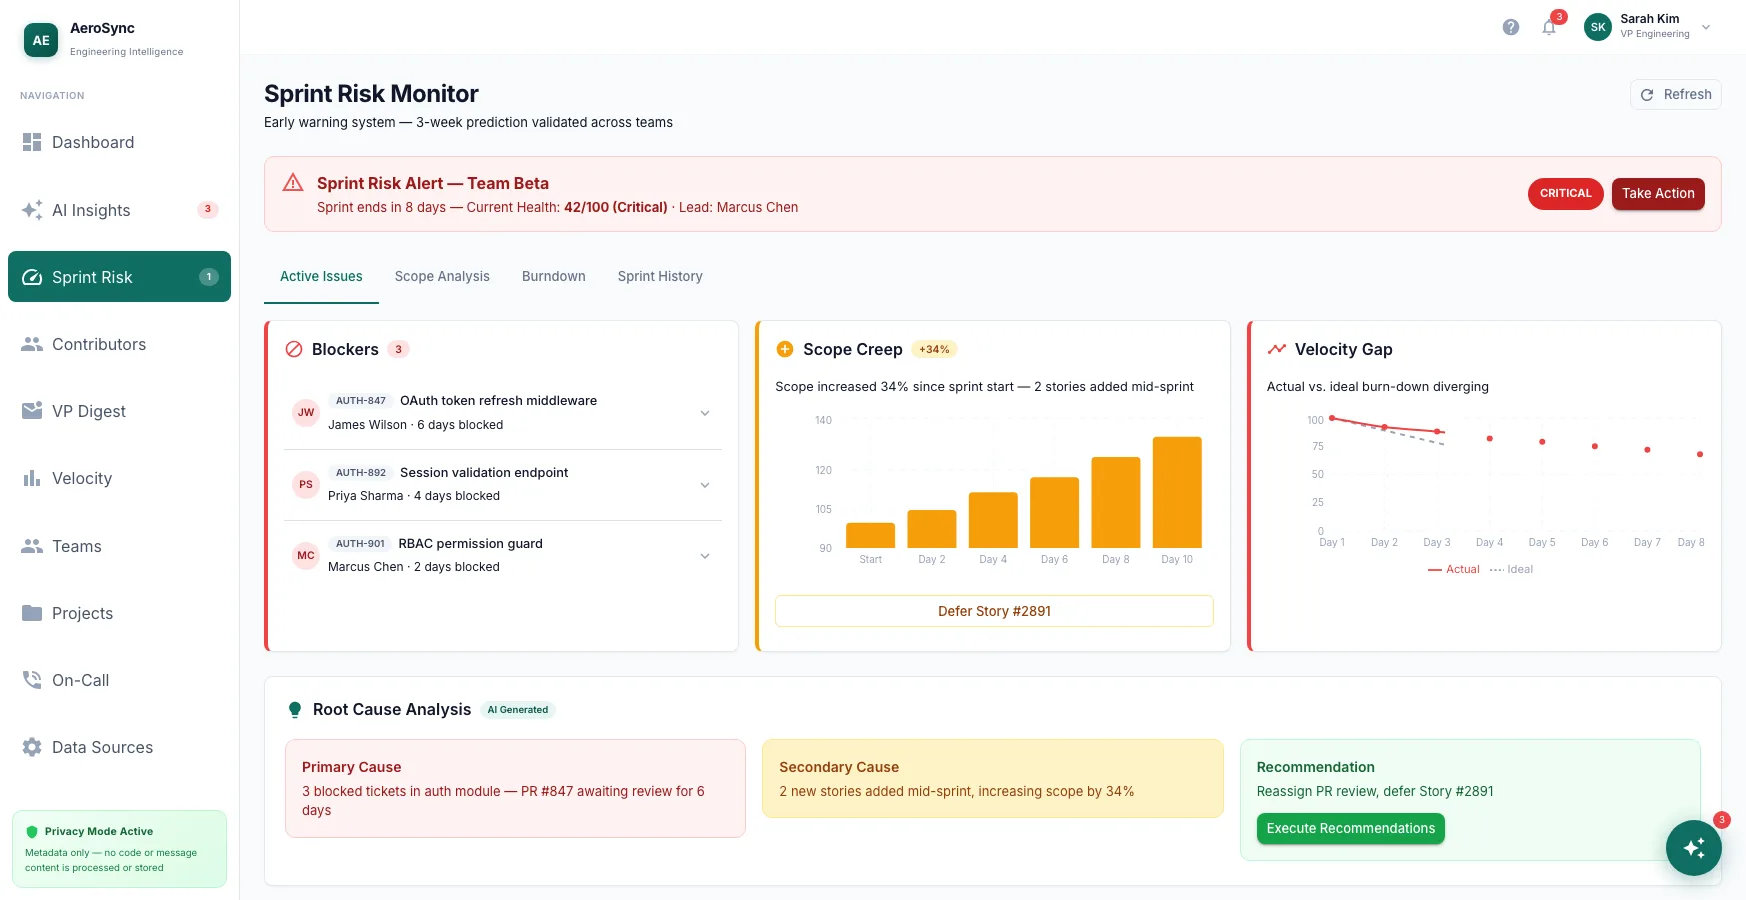
Surfaces sprint failure risk 3 weeks out, with the specific root cause instead of a vague "at risk" flag.
- Live blocker list with assignee and days-blocked per ticket
- Scope creep chart showing overrun since sprint start
- Actual vs. ideal burn-down comparison
- AI-generated root cause + one-click recommended action
Contributor Health & Burnout Detection
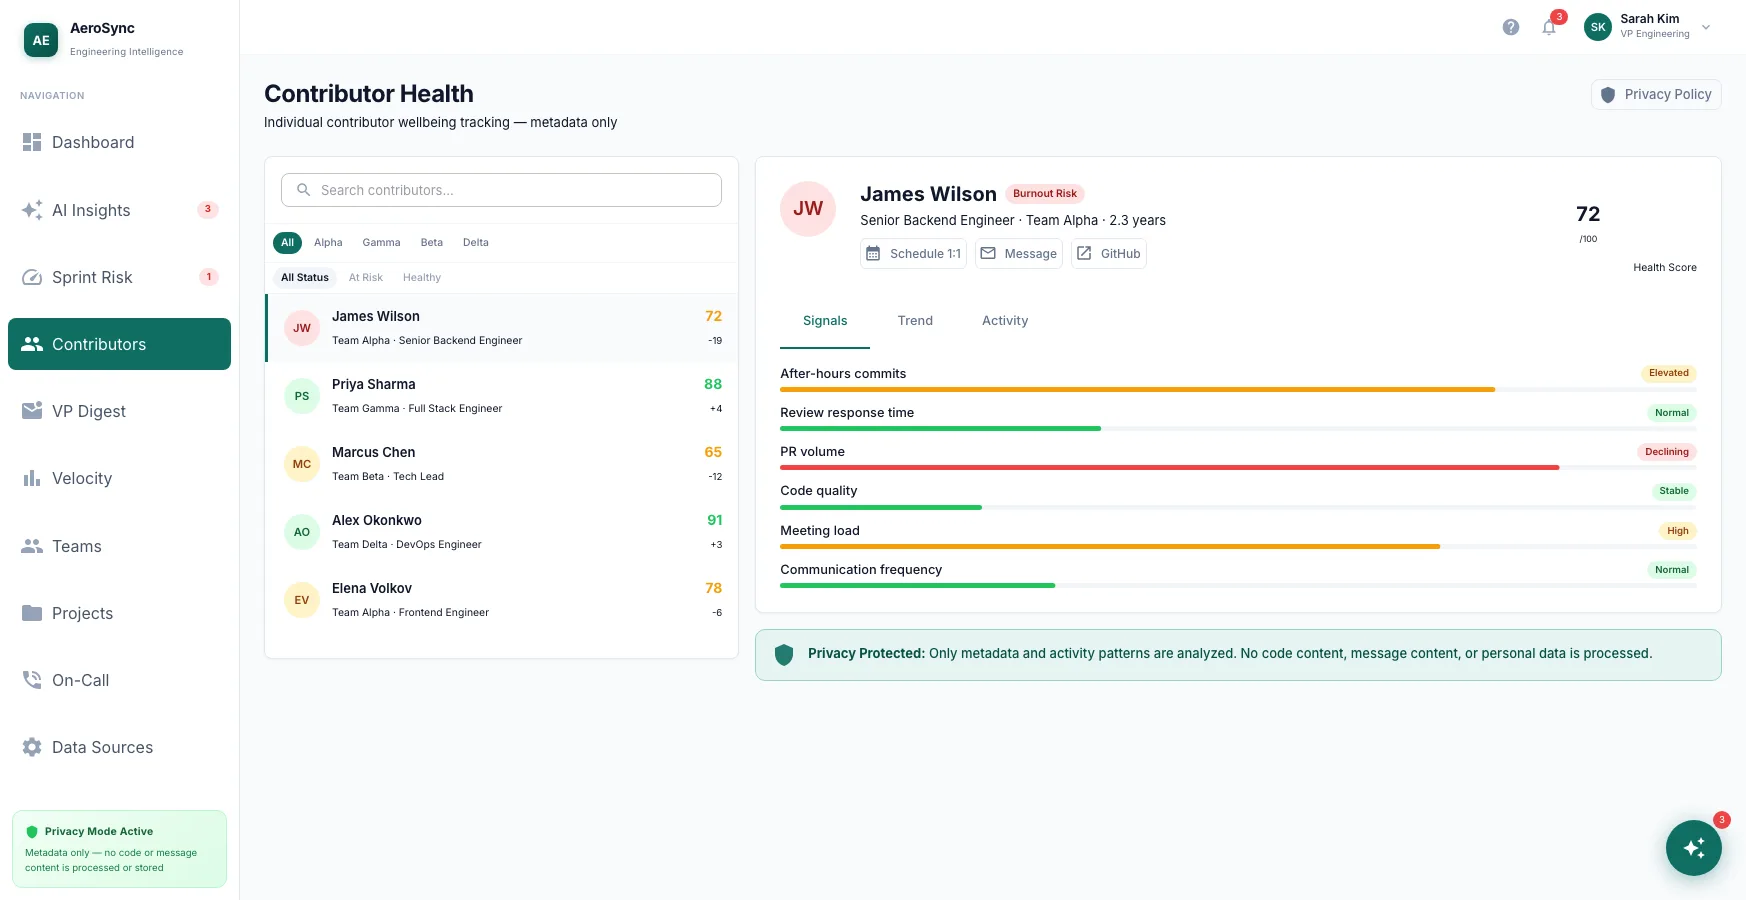
Per-contributor wellbeing tracking from 6 behavioral signals — metadata only, no code or message content ever read.
- Health score with 12-week trend per contributor
- Signal breakdown: after-hours commits, review lag, PR volume, meeting load
- Automatic burnout-risk flagging with severity labels
- Privacy-protected badge reinforcing metadata-only analysis
Team Velocity Comparison
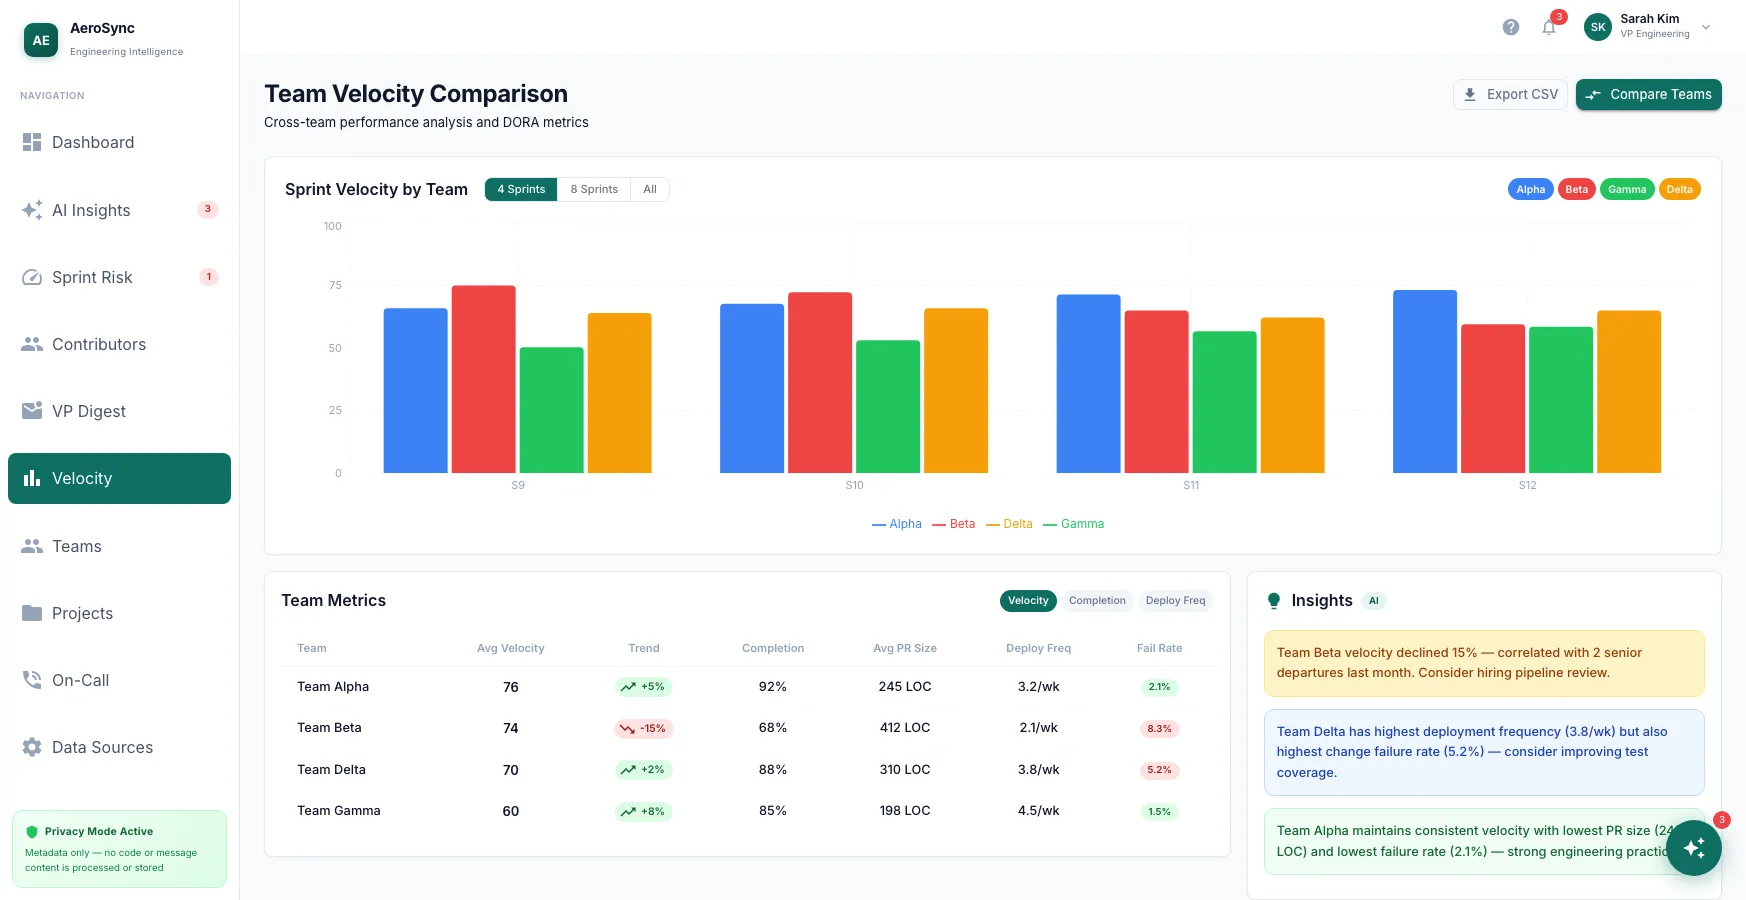
Cross-team velocity, completion rate, and DORA metrics side by side, with AI-generated insights explaining the "why" behind each trend.
- Grouped bar chart comparing 4 teams across sprints
- Sortable metrics table: velocity, completion, PR size, deploy frequency, fail rate
- AI insights correlating velocity drops with team changes
- Toggleable team visibility for focused comparison
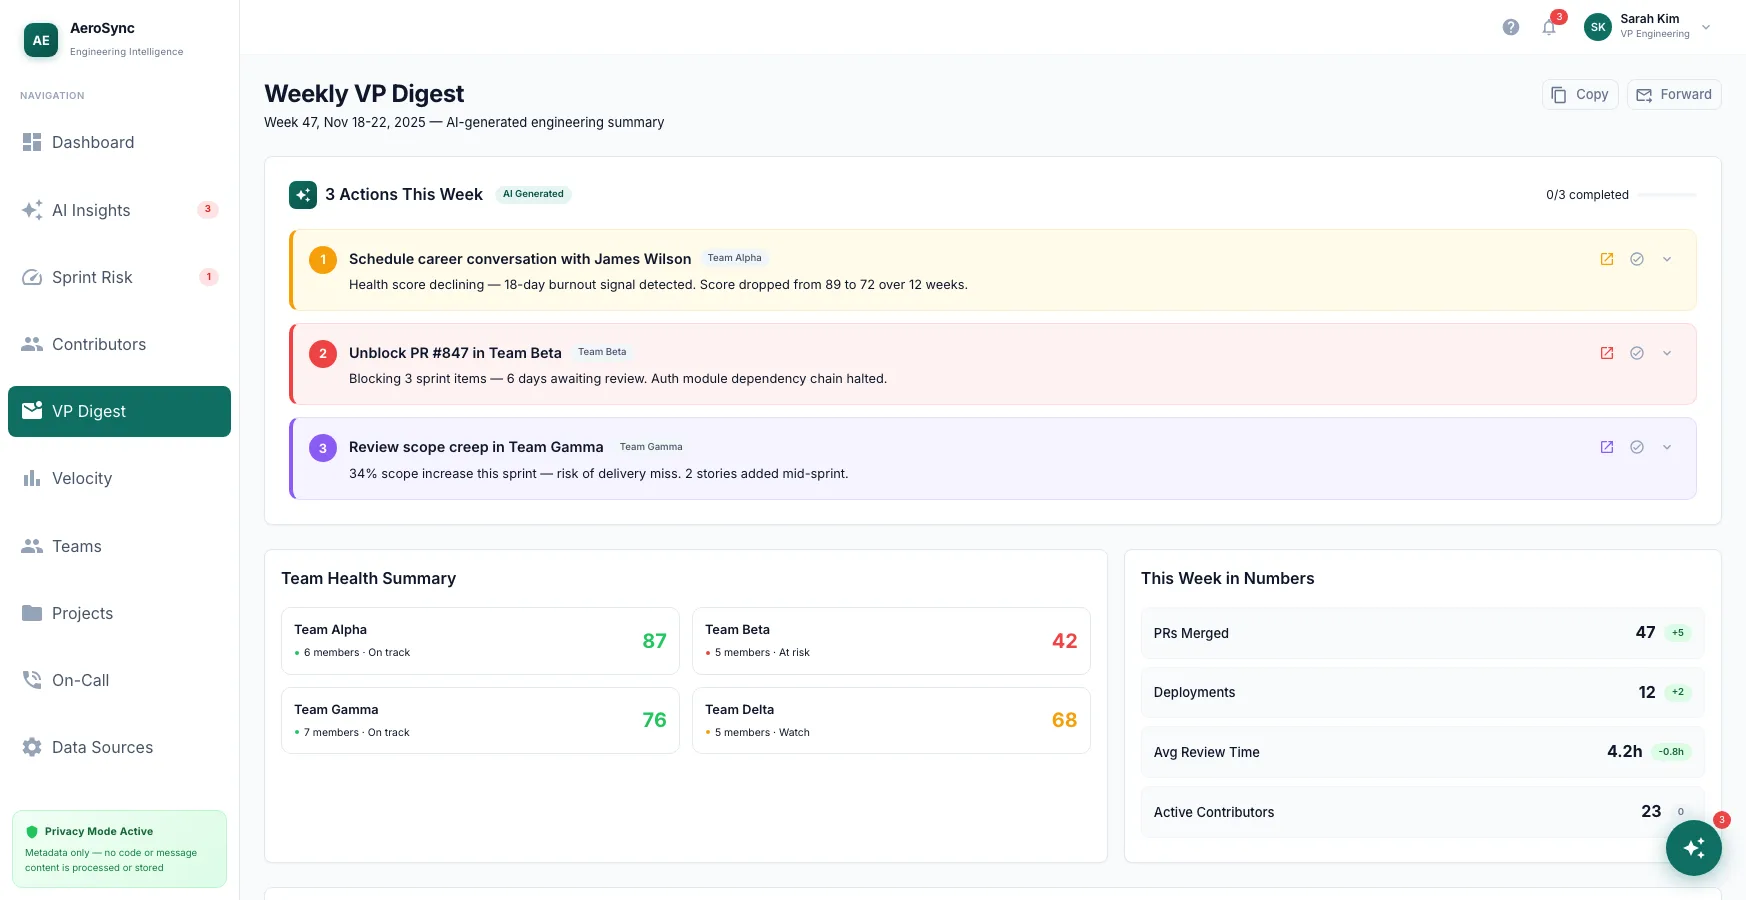
Weekly VP Digest
Three actions, not thirty metrics — the weekly summary a VP actually reads in five minutes.
- 3 AI-generated priority actions with team tags and one-click execute
- Team health summary across all 4 teams
- This-week-in-numbers snapshot: PRs merged, deployments, review time
- Past digest archive for week-over-week comparison
The AI Layer
Two models run in parallel. The sprint risk model analyses PR velocity, review lag, blocked tickets, and scope creep signals — producing a sprint health score updated daily. When the score crosses a threshold, the system surfaces the specific blocker (not just "your sprint is at risk"). The burnout prediction model tracks after-hours commit patterns, review response times, and meeting load against each contributor's baseline — flagging individuals showing early burnout signals 2–3 weeks before it typically manifests as a resignation or significant quality drop. No message content, no code content is ever read — only metadata and activity patterns.
Results
- •28% improvement in sprint delivery predictability
- •Burnout signals detected average 18 days before resignation
- •Deployed across 4 enterprise engineering teams
- •3-week early warning on sprint risk consistently validated
- •Zero code content or message content processed — pure metadata